
- Sat Jun 13, 2015 11:39 am
#20366
Introduction
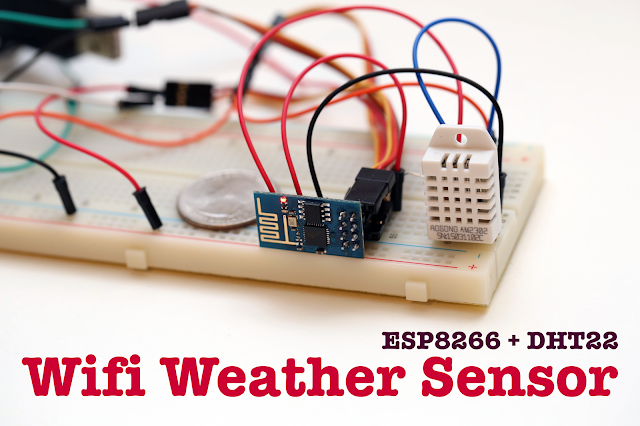
Low-cost Wireless Weather Monitoring System
Purpose
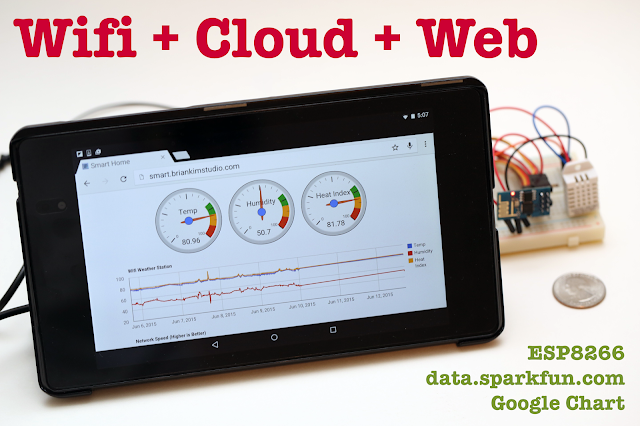
This system transmits temperature and humidity data to cloud on internet via Wifi and provides web interface to monitor those measured information.
In this system, ESP8266 reads data from DHT22 sensor, then, send it to data.sparkfun.com cloud system using simple HTTP protocol. For web interface, all charts are implemented with Google Chart APIs.
Prerequisites
- Arduino IDE
- ESP8266 package for Arduino IDE (*Refer to http://hpclab.blogspot.com/2015/06/esp8 ... -os-x.html for more information)
Compiling and uploading is done in Arduino IDE with ESP8266 package installed. Therefore, basic knowledge about Arduino IDE is required to proceed following steps.
Requirements
Hardware
-ESP8266 ( Around $3 on ebay )
-DHT22 ( Around $7 on eBay )
-Resistor 10k(Pull up)
To keep the cost low, ESP8266 is used as not only controller, but also Wifi transmitter. DHT22 sensor can be replaced by any other temperature sensor. Pull up resistor is used for the input pin of ESP8266.
Software
-data.sparkfun.com
-Google Chart
We used data.sparkfun.com cloud system to store measured data with two reasons. First, it provides free service and even does not require any account. We just need to create a 'free stream', which is basically a storage area. Secondly, it's easy to use. A single HTTP GET request can send measured data to cloud.
For web interface, Google Chart is used to draw gauge and graph to show historical change of temperature, humidity, and heat index.
Instructions
Setup hardware
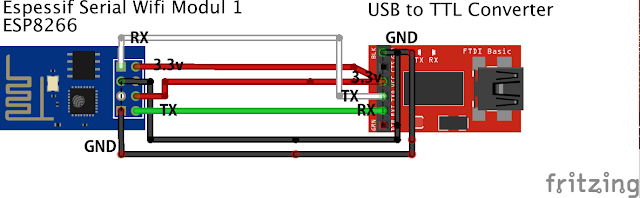
For uploading
Here is a wiring information to upload sketch to ESP8266 using USB to TTL converter. Since my converter is 5v version, I used another power supply to provide 3.3v to ESP8266. GPIO 0 should be pulled down to the ground for uploading.
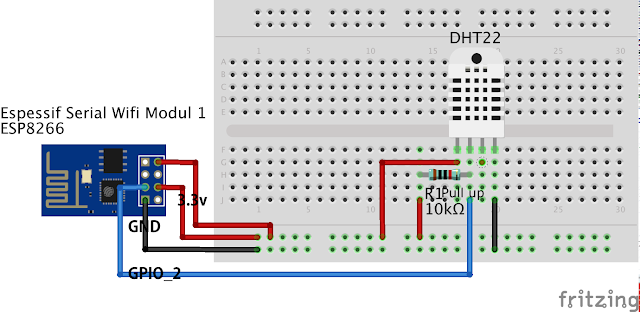
For running
Connect ESP8266 to DHT22 temperature sensor. GPIO 2 pin of ESP8266 is used to read measured data of DHT22.
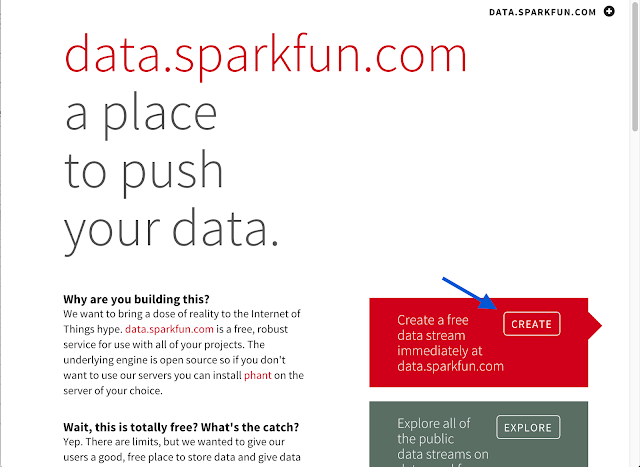
Step 1. Create 'free data stream' at data.sparkfun.com
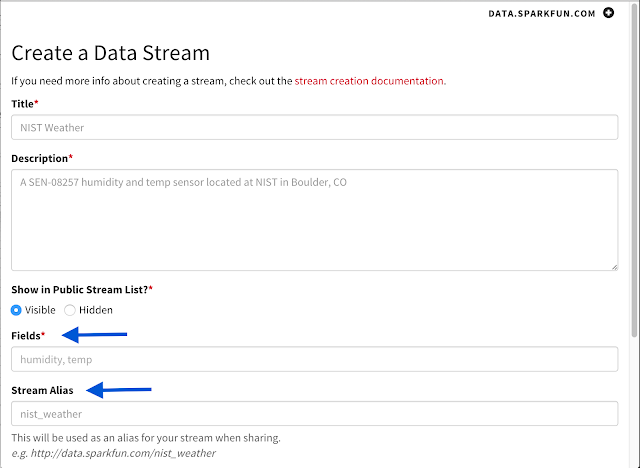
Visit https://data.sparkfun.com/ and click 'CREATE' menu to create a 'free data stream'. It's like an identifier for your data to read and write. One interesting feature of data.sparkfun.com is that it doesn't require you to create or activate any account. Just create 'free data stream'. Just remember that no more than 100 requests within 15 minutes window are allowed. On average, one request is allowed every 9 seconds. Check here for detail.
Among several fields in the creation form, 'Fields' and 'Stream Alias' are important. Fields are actual variable name for data when you send it with HTTP GET request. 'Stream Alias' is a name which can be used in URL to retrieve data from cloud.
Once you finish creating 'stream', it provides several information such as private key, public key and simple instructions on how to send and retrieve data. Don't loose them, you need them to proceed to the next step.
Step 2. Upload Sketch
For this step, you need those information at hand,
-SSID & Password of you Access Point
-List of field names you typed in 'Fields' in the creation form in Step 1
-Public Key from Step 1
-Private Key from Step 1
In this example, we used 3 fields to send data to cloud,
-temp: for temperature value measured in DHT22
-hum: for humidity value measured in DHT22
-hidx: for heat index calculated in the sketch
HTTP GET request for sending data looks like this,
data.sparkfun.com/input/YOUR_PUBLIC_KEY?private_key=YOUR_PRIVATE_KEY&temp=82.04&hum=53.10&hidx=83.29
Modify those values in the sketch according to your configuration. Then, compile and upload to ESP8266 using USB to TTL converter. If you face errors on Mac machine, refer to http://hpclab.blogspot.com/2015/06/esp8 ... -os-x.html for solution.
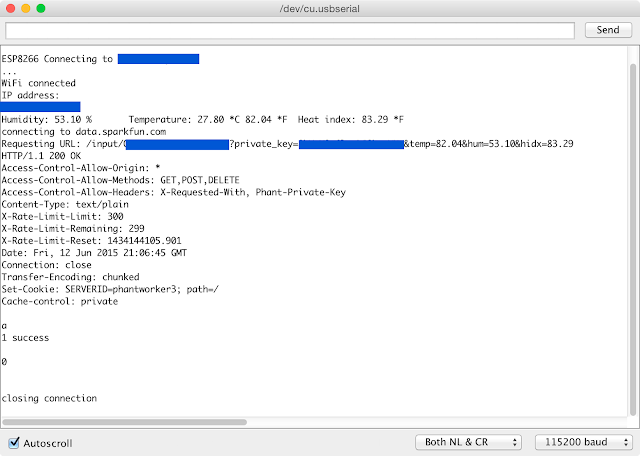
Once finish uploading, open 'Serial Monitor' in Arduino IDE, then you will see something like this,
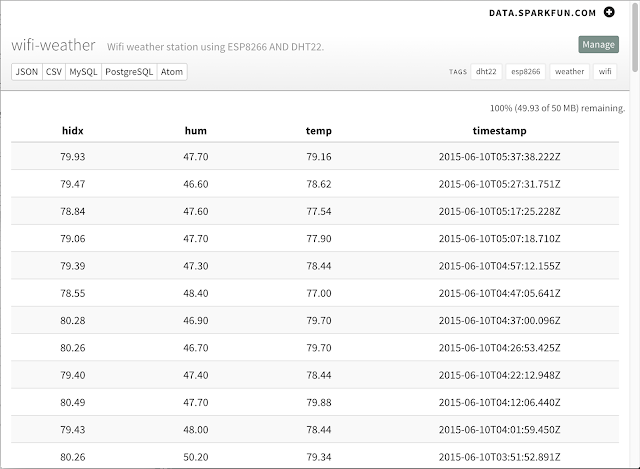
To verify whether the data has been transmitted and stored in cloud without error, type this URL in web browser.
https://data.sparkfun.com/streams/YOUR_PUBLIC_KEY
You will see this kind of output if everything has gone well.
Step 3. Create HTML file
For this step, you need this information at hand,
-Public key from Step 1
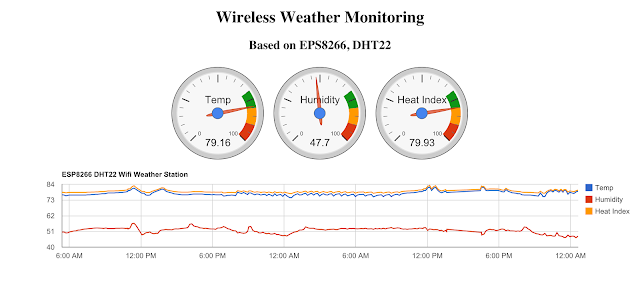
Modify the value of public_key to your own key in example HTML file for web interface. Basically, it retrieves data in JSON format from cloud, then pass it to Google Chart API for drawing chart. In this example, gauge chart and line chart are used for demonstration.
Results
Open HTML file with web browser, then you will see this chart right away. If you would like to access web interface from anywhere in the world, then, just upload this HTML file to your web site. It does not require any additional files or libraries or anything, just one single HTML file. That's it!
References
https://data.sparkfun.com/
http://phant.io/graphing/google/2014/07 ... hing-data/
http://hpclab.blogspot.com/2015/06/esp8 ... -os-x.html
https://developers.google.com/chart/
Introduction
Low-cost Wireless Weather Monitoring System
Purpose
This system transmits temperature and humidity data to cloud on internet via Wifi and provides web interface to monitor those measured information.
In this system, ESP8266 reads data from DHT22 sensor, then, send it to data.sparkfun.com cloud system using simple HTTP protocol. For web interface, all charts are implemented with Google Chart APIs.
Prerequisites
- Arduino IDE
- ESP8266 package for Arduino IDE (*Refer to http://hpclab.blogspot.com/2015/06/esp8 ... -os-x.html for more information)
Compiling and uploading is done in Arduino IDE with ESP8266 package installed. Therefore, basic knowledge about Arduino IDE is required to proceed following steps.
Requirements
Hardware
-ESP8266 ( Around $3 on ebay )
-DHT22 ( Around $7 on eBay )
-Resistor 10k(Pull up)
To keep the cost low, ESP8266 is used as not only controller, but also Wifi transmitter. DHT22 sensor can be replaced by any other temperature sensor. Pull up resistor is used for the input pin of ESP8266.
Software
-data.sparkfun.com
-Google Chart
We used data.sparkfun.com cloud system to store measured data with two reasons. First, it provides free service and even does not require any account. We just need to create a 'free stream', which is basically a storage area. Secondly, it's easy to use. A single HTTP GET request can send measured data to cloud.
For web interface, Google Chart is used to draw gauge and graph to show historical change of temperature, humidity, and heat index.
Instructions
Setup hardware
For uploading
Here is a wiring information to upload sketch to ESP8266 using USB to TTL converter. Since my converter is 5v version, I used another power supply to provide 3.3v to ESP8266. GPIO 0 should be pulled down to the ground for uploading.
For running
Connect ESP8266 to DHT22 temperature sensor. GPIO 2 pin of ESP8266 is used to read measured data of DHT22.
Step 1. Create 'free data stream' at data.sparkfun.com
Visit https://data.sparkfun.com/ and click 'CREATE' menu to create a 'free data stream'. It's like an identifier for your data to read and write. One interesting feature of data.sparkfun.com is that it doesn't require you to create or activate any account. Just create 'free data stream'. Just remember that no more than 100 requests within 15 minutes window are allowed. On average, one request is allowed every 9 seconds. Check here for detail.
Among several fields in the creation form, 'Fields' and 'Stream Alias' are important. Fields are actual variable name for data when you send it with HTTP GET request. 'Stream Alias' is a name which can be used in URL to retrieve data from cloud.
Once you finish creating 'stream', it provides several information such as private key, public key and simple instructions on how to send and retrieve data. Don't loose them, you need them to proceed to the next step.
Step 2. Upload Sketch
For this step, you need those information at hand,
-SSID & Password of you Access Point
-List of field names you typed in 'Fields' in the creation form in Step 1
-Public Key from Step 1
-Private Key from Step 1
In this example, we used 3 fields to send data to cloud,
-temp: for temperature value measured in DHT22
-hum: for humidity value measured in DHT22
-hidx: for heat index calculated in the sketch
HTTP GET request for sending data looks like this,
data.sparkfun.com/input/YOUR_PUBLIC_KEY?private_key=YOUR_PRIVATE_KEY&temp=82.04&hum=53.10&hidx=83.29
Modify those values in the sketch according to your configuration. Then, compile and upload to ESP8266 using USB to TTL converter. If you face errors on Mac machine, refer to http://hpclab.blogspot.com/2015/06/esp8 ... -os-x.html for solution.
Once finish uploading, open 'Serial Monitor' in Arduino IDE, then you will see something like this,
To verify whether the data has been transmitted and stored in cloud without error, type this URL in web browser.
https://data.sparkfun.com/streams/YOUR_PUBLIC_KEY
You will see this kind of output if everything has gone well.
Code: Select all
/*
 *  This sketch sends data via HTTP GET requests to data.sparkfun.com service.
 *
 *  You need to get streamId and privateKey at data.sparkfun.com and paste them
 *  below. Or just customize this script to talk to other HTTP servers.
 *
 */

#include <ESP8266WiFi.h>
#include "DHT.h"

#define DHTPIN 2     // GPIO 2 pin of ESP8266
#define DHTTYPE DHT22   // DHT 22  (AM2302)

const char* ssid     = "................";
const char* password = "................";

const char* host = "data.sparkfun.com";
const char* publicKey = "................";
const char* privateKey = "................";

DHT dht(DHTPIN, DHTTYPE,30); // 30 is for cpu clock of esp8266 80Mhz

void setup() {
  Serial.begin(115200);

  dht.begin();

  delay(10);

  // We start by connecting to a WiFi network

  Serial.println();
  Serial.println();
  Serial.print("ESP8266 Connecting to ");
  Serial.println(ssid);

  WiFi.begin(ssid, password);

  while (WiFi.status() != WL_CONNECTED) {
    delay(500);
    Serial.print(".");
  }

  Serial.println("");
  Serial.println("WiFi connected");
  Serial.println("IP address: ");
  Serial.println(WiFi.localIP());
}

void loop() {
  delay(5000);

  // Reading temperature or humidity takes about 250 milliseconds!
  // Sensor readings may also be up to 2 seconds 'old' (its a very slow sensor)
  float h = dht.readHumidity();
  // Read temperature as Celsius
  float t = dht.readTemperature();
  // Read temperature as Fahrenheit
  float f = dht.readTemperature(true);

  // Check if any reads failed and exit early (to try again).
  if (isnan(h) || isnan(t) || isnan(f)) {
    Serial.println("Failed to read from DHT sensor!");
    return;
  }

  // Compute heat index
  // Must send in temp in Fahrenheit!
  float hi = dht.computeHeatIndex(f, h);

  Serial.print("Humidity: ");
  Serial.print(h);
  Serial.print(" %\t");
  Serial.print("Temperature: ");
  Serial.print(t);
  Serial.print(" *C ");
  Serial.print(f);
  Serial.print(" *F\t");
  Serial.print("Heat index: ");
  Serial.print(hi);
  Serial.println(" *F");

  Serial.print("connecting to ");
  Serial.println(host);

  // Use WiFiClient class to create TCP connections
  WiFiClient client;
  const int httpPort = 80;
  if (!client.connect(host, httpPort)) {
    Serial.println("connection failed");
    return;
  }

  // We now create a URI for the request
  String url = "/input/";
  url += publicKey;
  url += "?private_key=";
  url += privateKey;
  url += "&temp=";
  url += f;
  url += "&hum=";
  url += h;
  url += "&hidx=";
  url += hi;

  Serial.print("Requesting URL: ");
  Serial.println(url);

  // This will send the request to the server
  client.print(String("GET ") + url + " HTTP/1.1\r\n" +
               "Host: " + host + "\r\n" +
               "Connection: close\r\n\r\n");
  delay(10);

  // Read all the lines of the reply from server and print them to Serial
  while(client.available()){
    String line = client.readStringUntil('\r');
    Serial.print(line);
  }

  Serial.println();
  Serial.println("closing connection");
  delay(600000); // Send data every 10 minutes
}
Step 3. Create HTML file
For this step, you need this information at hand,
-Public key from Step 1
Modify the value of public_key to your own key in example HTML file for web interface. Basically, it retrieves data in JSON format from cloud, then pass it to Google Chart API for drawing chart. In this example, gauge chart and line chart are used for demonstration.
Code: Select all
<!DOCTYPE html>
<html>
  <head>
    <title>Smart Home</title>
    <!-- EXTERNAL LIBS-->
    <script src="https://ajax.googleapis.com/ajax/libs/jquery/1.11.1/jquery.min.js"></script>
    <script src="https://www.google.com/jsapi"></script>

    <!-- EXAMPLE SCRIPT -->
    <script>

      // onload callback
      function drawChart() {

        var cloud_url = 'https://data.sparkfun.com/output/';
        // Public Key from https://data.sparkfun.com
        var public_key = '................';

        // JSONP request
        var jsonData = $.ajax({
          url:  cloud_url + public_key + '.json',
          data: {page: 1},
          dataType: 'jsonp',
        }).done(function (results) {
          var latest = results[0];
          var gauge = new google.visualization.Gauge($('#gauge').get(0));
          var gaugeData = google.visualization.arrayToDataTable([
            ['Label', 'Value'],
            ['Temp', 0],
            ['Humidity', 0],
            ['Heat Index', 0]
          ]);
          var options = {
            width: 600,
            redFrom: 90, redTo: 100,
            yellowFrom:80, yellowTo: 90,
            greenFrom:70, greenTo: 80,
            minorTicks: 5
          };

          // For animation purpose only
          gauge.draw(gaugeData,options);

          // Show real data
          gaugeData.setValue(0,1,parseFloat(latest.temp));
          gaugeData.setValue(1,1,parseFloat(latest.hum));
          gaugeData.setValue(2,1,parseFloat(latest.hidx));

          gauge.draw(gaugeData,options);

          var data = new google.visualization.DataTable();

          data.addColumn('datetime', 'Time');
          data.addColumn('number', 'Temp');
          data.addColumn('number', 'Humidity');
          data.addColumn('number', 'Heat Index');

          $.each(results, function (i, row) {
            data.addRow([
              (new Date(row.timestamp)),
              parseFloat(row.temp),
              parseFloat(row.hum),
              parseFloat(row.hidx)
            ]);
          });

          var chart = new google.visualization.LineChart($('#temperature').get(0));
          chart.draw(data, {
            title: 'ESP8266 DHT22 Wifi Weather Station'
          });

        });
      }

      // load chart lib
      google.load('visualization', '1', {
        packages: ['corechart','gauge']
      });

      // call drawChart once google charts is loaded
      google.setOnLoadCallback(drawChart);
    </script>

  </head>
  <body style="text-align:center">
    <h1 >Wireless Weather Monitoring</h1>
    <h2>Based on EPS8266, DHT22</h2>
    <div id="gauge" style="width:600px;margin-left:auto;margin-right:auto"></div>
    <div id="temperature" style="width: 100%;"></div>
  </body>
</html>
Results
Open HTML file with web browser, then you will see this chart right away. If you would like to access web interface from anywhere in the world, then, just upload this HTML file to your web site. It does not require any additional files or libraries or anything, just one single HTML file. That's it!
References
https://data.sparkfun.com/
http://phant.io/graphing/google/2014/07 ... hing-data/
http://hpclab.blogspot.com/2015/06/esp8 ... -os-x.html
https://developers.google.com/chart/


